
Every now and then the actual numbers surprise me. In several posts I’ve tried to show what the markets looke like in the post LENR era (or, if it’s easier to comprehend, post Saudi unlimited oil production era). Not taking the investment risk (volatility) into account in those charts might look nice and powerful, but in reality doesn’t say much about the actual global capital flows as a whole.
So, I put together a chart where I take volatility/risk into account on daily basis, adjusting movements with a 14 day ATR (average true range). Here it is:

The first thing that hits, is that cash USD has outperformed everything. Although since everything is measured in USD that is not entirely true. Putting your USD cash in 20y+ treasuries have been even better and so also some sectors of the stock market like health and med care, utilities and consumer goods.
The next thing that hits, is that it’s obvoius that staying out of European currencies and commodities, especially oil, have been a really good idea.
The third and last thing is that this massive market move has been over since april 2015. Since then the markets have been relatively stable!! China is having serious trouble, and of course oil, copper and energy. And high yield corporate bonds have been a real mess.
Here is another way to look at it in terms of 3-12 months strength/trend, with 2-3 week momentum (color).
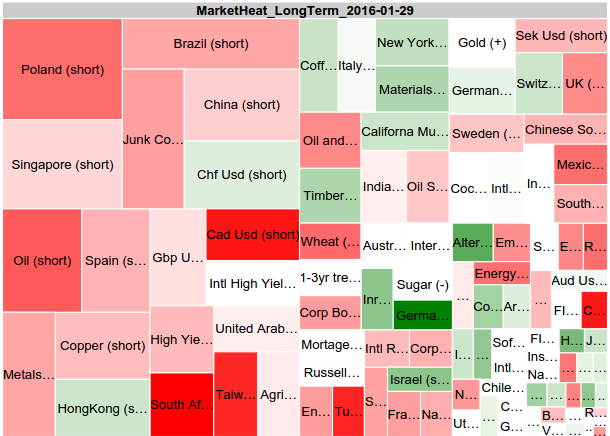
As we can see many asian, european and emerging markets (Poland, Singapore, Brazil, Spain, Hong Kong, etc.) are having trouble. Including some currencies (GBP, CAD, CHF) and commodities (oil mainly). Also the high yield bond market has shown seriuos troubles since april being among worst performers (oil exploration is not a wild guess here …).
Allthough weaker the trend continues. While USD and US treasuries have been stable, capital flow is moving from the areas mentioned above to primarily German, Japanese, US corp. and municipal bonds. Among stocks (US market) Utilities and Consumer goods (and technology) shows best performance in a week to month timeframe.
Has this anything to do with LENR then?
Certainly not directly. However the insight that there are way more oil both in the ground, and above right now, than will be consumed in any foreseable future is fundamental for the Saudi all in production strategy (incl. Russia, Iran, Iraq, etc). And then they all desperately need the cashflow for various domestic reasons. They realize that oil in the ground is worse than a NIRP bank account. I mean, if they believed for a second that the price of oil would rise again, keeping it in the ground for now and print money (sell bonds) for cashflow would be good business. But obviously that is not their strategy …
Finally, from the positive side, I’d like to focus on the fact that Utilities, Technology and Consumer goods are the markets performing well. I do not think this is a coincidene from an energy price perspective:
We will use more energy,
LENR will be integrated,
the Utilities will charge for the bandwidth,
innovation will be intense,
and the money saved will be used for consumption.